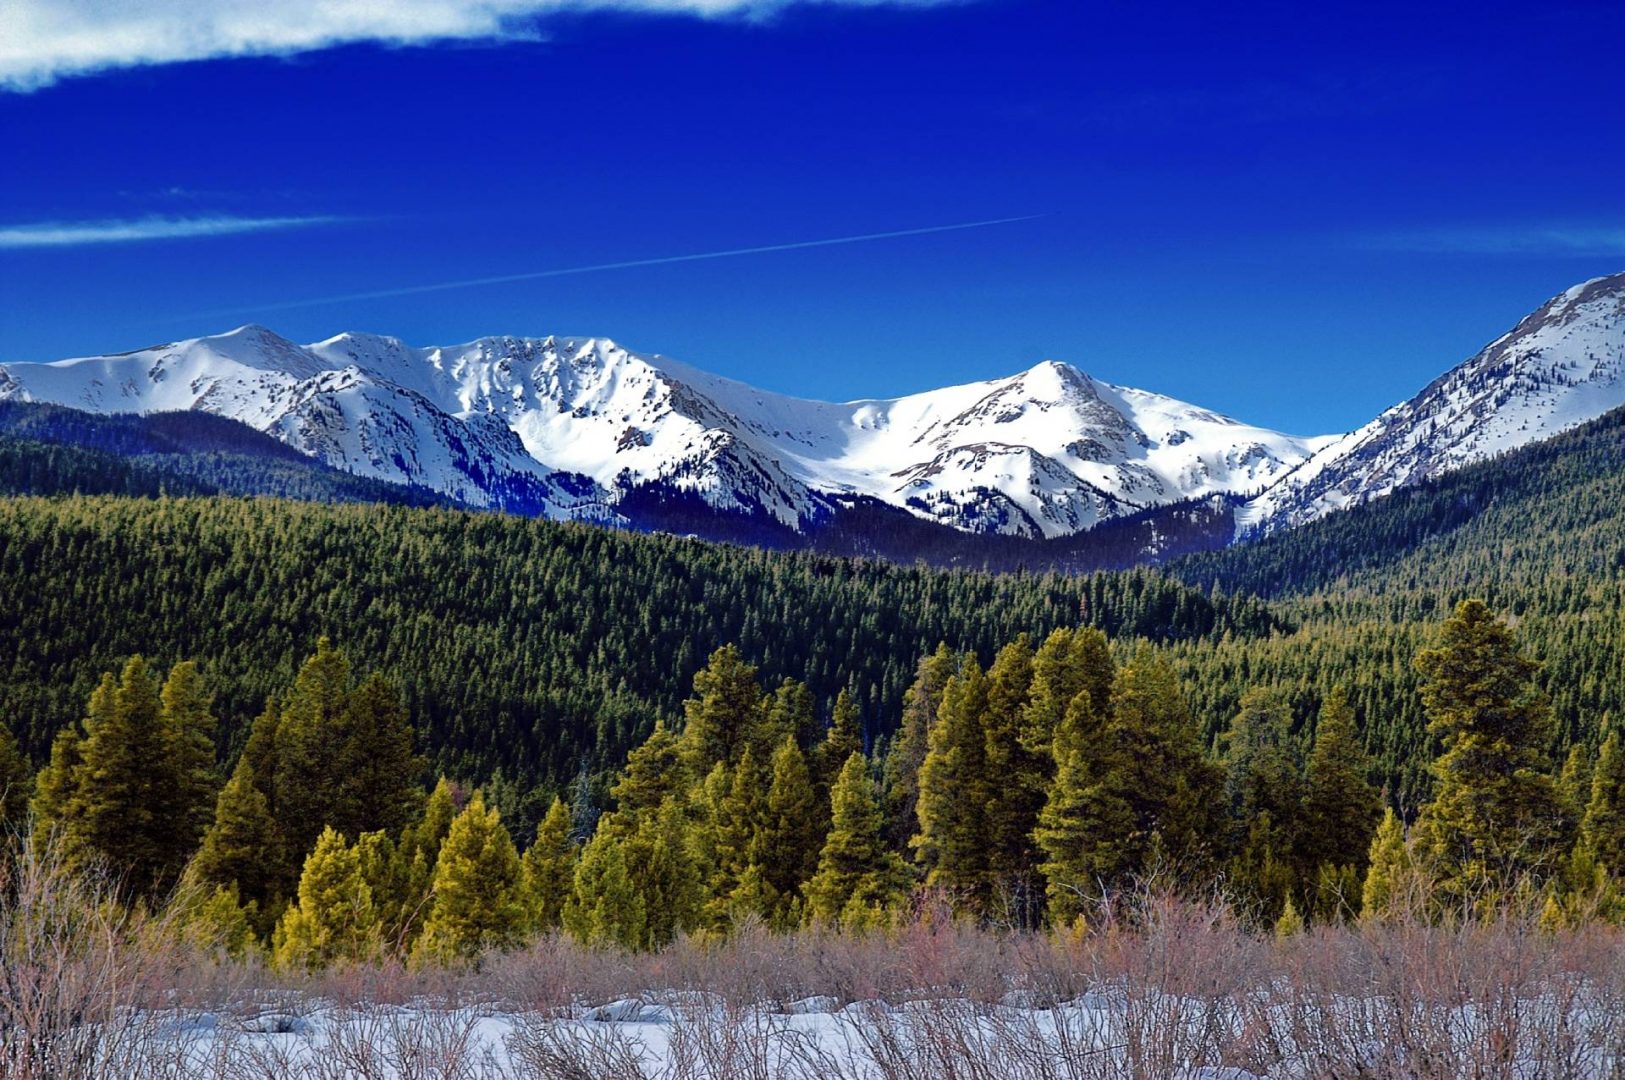
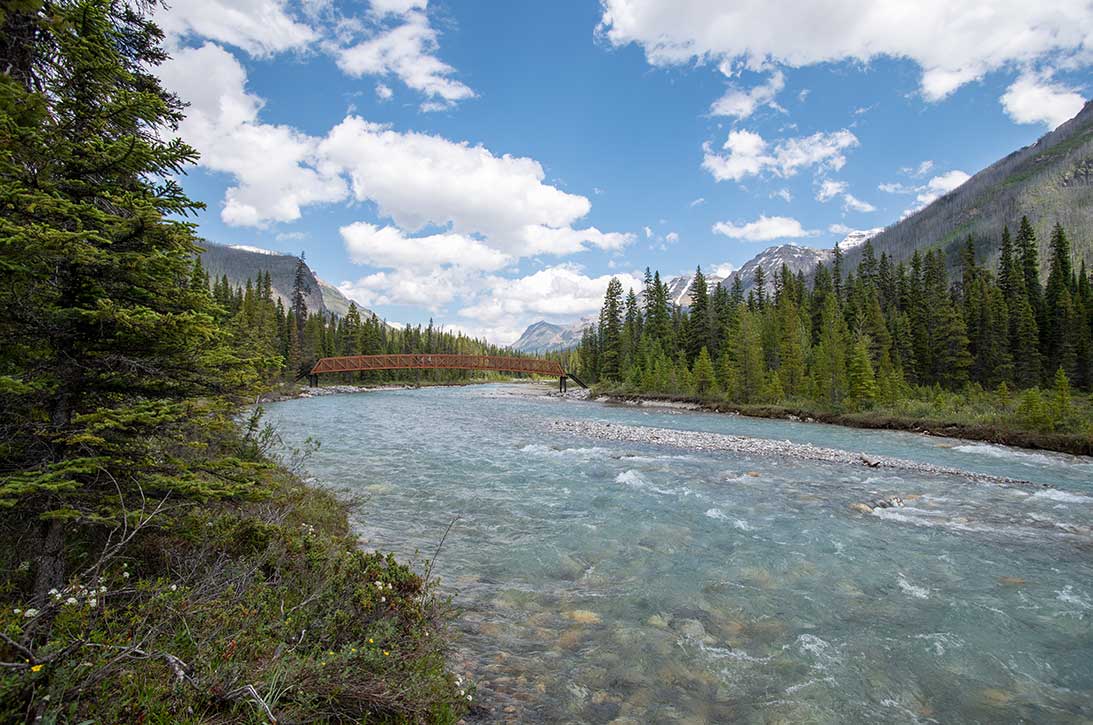
The climate in the southeastern corner of British Columbia is difficult to generalize. The area is filled with many different micro-climates and the weather patterns can vary widely, often within just a few kilometres of each other. The most reliable way to determine the climatic conditions around New Denver is to view the statistics in the Slocan Lake area in general. This too will vary somewhat from one side of the lake to the other but the consistent data collected on the lake provides the most accurate information about the weather conditions you can expect in the New Denver area. Keep in mind that in some of the mountain areas just a couple of miles away the statistics can be quite different. For our purposes here we will concentrate on monthly climate data regarding temperature, rainfall and snowfall. For consistency purposes we will view the average stats in each category for each month of the year for both 2018 and 2019. Of course the New Denver area is beautiful during all times of year but this will give you some notion of the relative conditions in the area which you can expect to find during your planned trip to the New Denver Lodge.
Temperature average per month from January through December of 2018
Jan -4 c (25 f)
Feb -9 c (16 f)
Mar -3 c (27 f)
Apr 2 c (36 f)
May 12 c (54 f)
Jun 11 c (52 f)
Jul 17 c (63 f)
Aug 16 c (61 f)
Sep 8 c (46 f)
Oct 9 c (48 f)
Nov 3 c (37 f)
Dec 0 c (32 f)
Temperature average per month from January through December of 2019
Jan 0 c (32 f)
Feb -4 c (25 f)
Mar -1 c (30 f)
Apr 5 c (41 f)
May 14 c (57 f)
Jun 16 c (61 f)
Jul 18 c (64 f)
Aug 20 c (68 f)
Sep 11 c (52 f)
Oct 1 c (34 f)
Nov -2 c (28 f)
Dec -4 c (25 f)
Average number of Rain Days and Average Rainfall Amounts in 2018
Jan 9 days 33 mm (1.30 in)
Feb 9 days 39 mm (1.54 in)
Mar 12 days 30 mm (1.18 in)
Apr 20 days 41 mm (1.61 in)
May 11 days 22 mm (.86 in)
Jun 15 days 44 mm (1.73 in)
Jul 4 days 13 mm (.51 in)
Aug 5 days 6 mm (.24 in)
Sep 13 days 22 mm (.87 in)
Oct 14 days 69 mm (2.72 in)
Nov 18 days 118 mm (4.64)
Dec 9 days 130 mm (5.12 in)
Average number of Rain Days and Average Rainfall Amounts in 2019
Jan 9 days 71 mm (2.79 in)
Feb 7 days 55 mm (2.17 in)
Mar 14 days 32 mm (1.26 in)
Apr 25 days 130 mm (5,12 in)
May 13 days 66 mm (2.60 in)
Jun 16 days 117 mm (4.60 in)
Jul 21 days 158 mm (6.22 in)
Aug 9 days 67 mm (2.64 in)
Sep 21 days 176 mm (6.93 in)
Oct 19 days 109 mm (4.29 in)
Nov 12 days 66 mm (2.60 in)
Dec 14 days 177 mm (6.97 in)
Average Snow Days and Average Snowfall amount in 2018
Jan 15 days 13.2 cm (5.20 in)
Feb 14 days 18.6 cm (7.32 in)
Mar 10 days 8.1 cm (3.18 in)
Apr 3 days 1.7 cm (.67 in)
May 0
Jun 0
Jul 0
Aug 0
Sep 0
Oct 0
Nov 8 days 14.5 cm (5.71 in)
Dec 17 days 63.1 cm (24.84 in)
Average Snow Days and Average Snowfall amount in 2019
Jan 13 days 24.1 cm (9.49 in)
Feb 21 days 25.3 cm (9.96 in)
Mar 11 days 9.8 cm (3.86 in)
Apr 5 days 9.6 cm (3.78 in)
May 0
Jun 0
Jul 0
Aug 0
Sep 2 days 6.4 cm (2.52 in)
Oct 3 days 5.1 cm (2.01 in)
Nov 6 days 10.7 cm (4.21 in)
Dec 22 days 53.0 cm 20.87 in)


